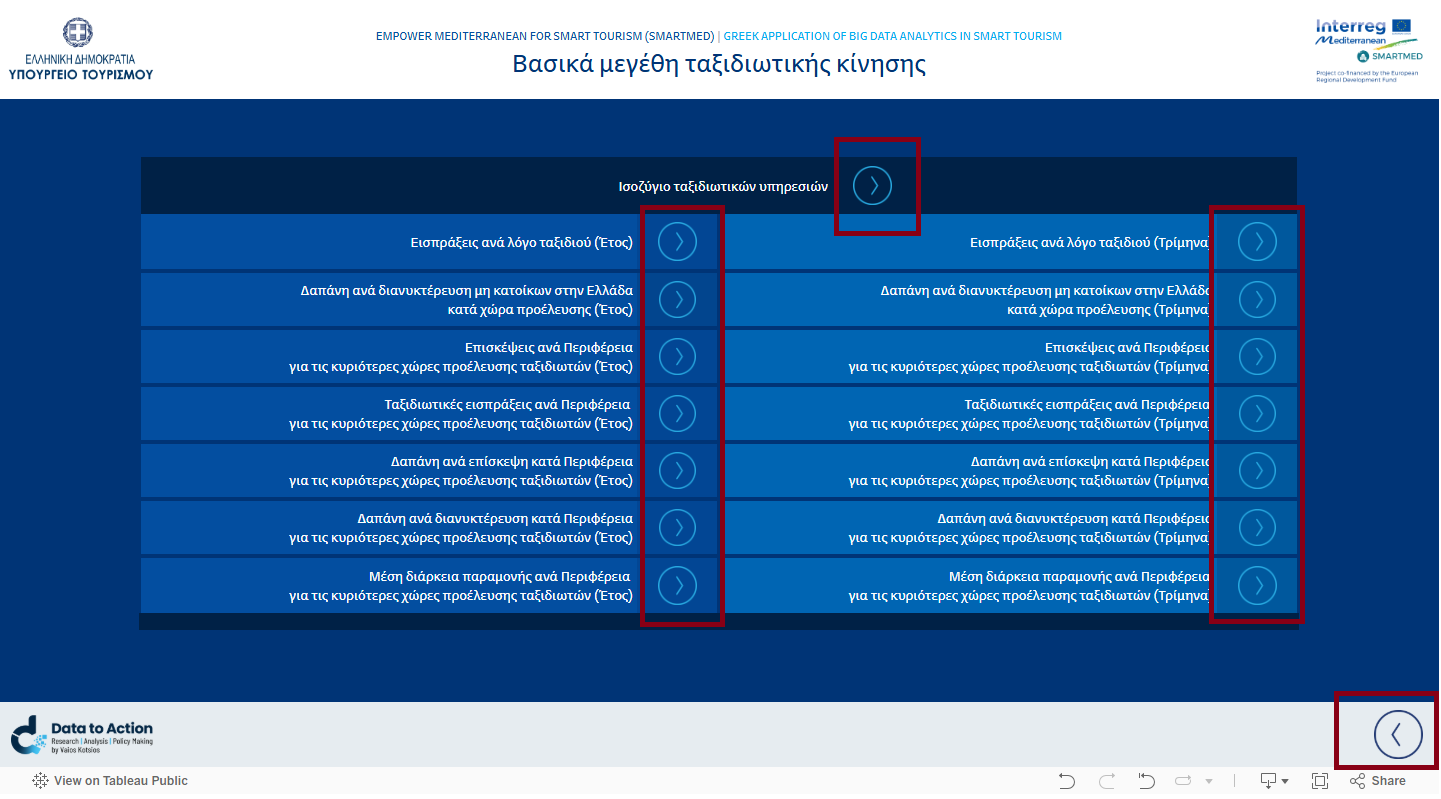
The basic forward and backward navigation within the interactive dashboards is performed within the Tableau environment using the corresponding arrows.
The navigation arrows allow you to move to individual thematic dashboards or additional levels of analysis.
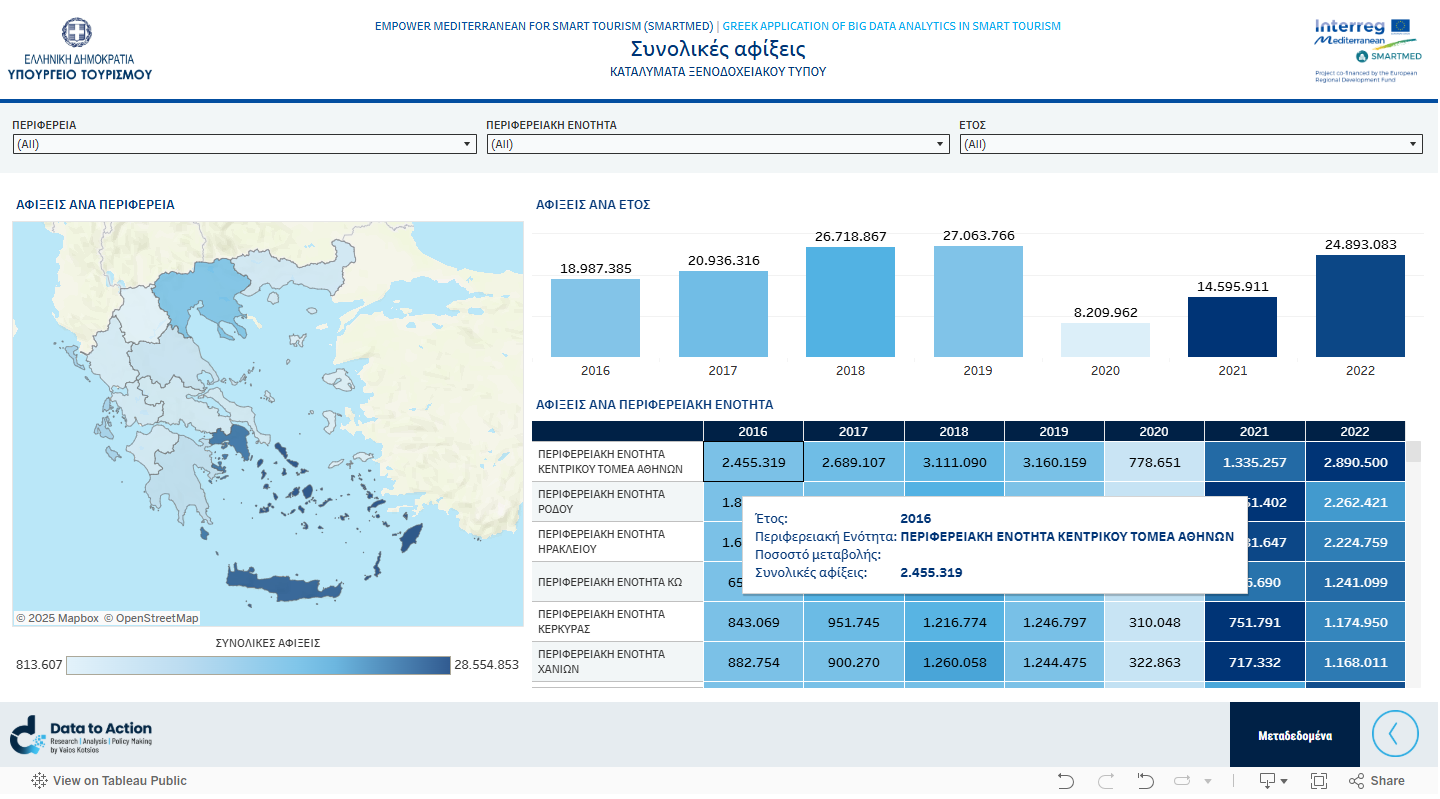
Each interactive dashboard may include tables, charts and/or maps.
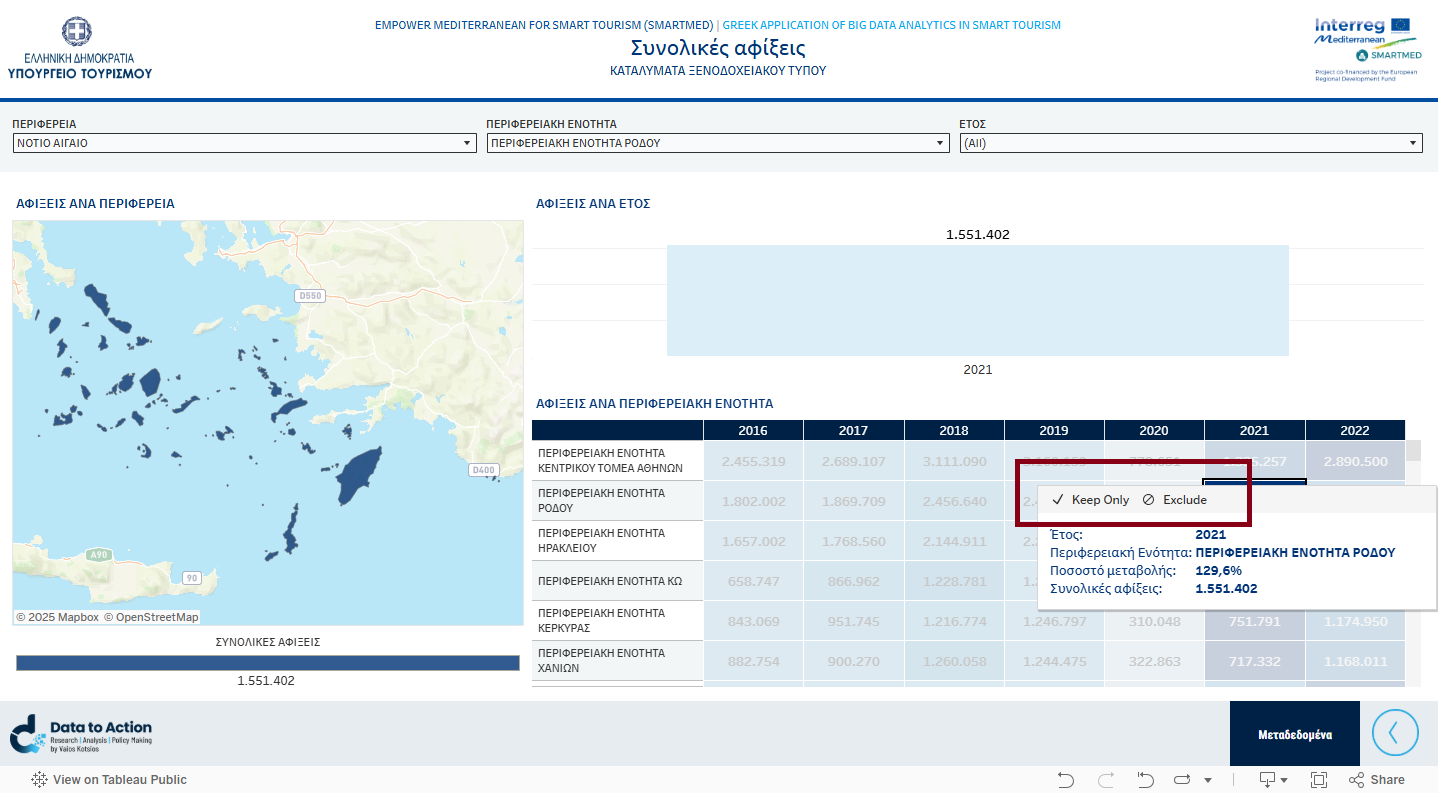
When you hover the mouse over an element, a tooltip appears with additional information (e.g. values, dates, percentages).
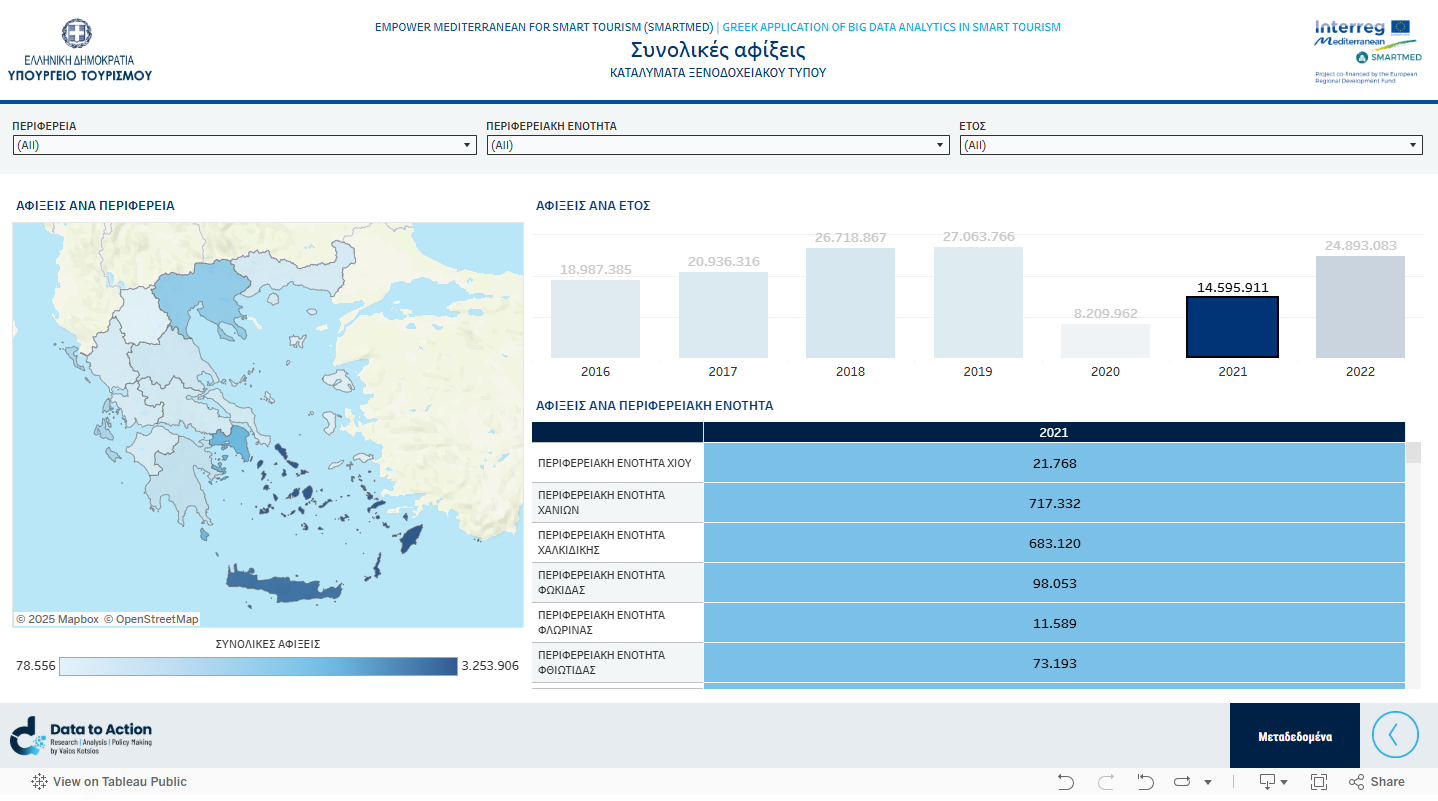
By clicking on a chart element, a field in a table (cell or column), or an area on the map, you refine (filter) the data. All related data are displayed with highlighting. In this way, you can easily see how the indicators are connected to each other.
In addition, once you select an element, you also have the following options in the tooltip:
Keep Only (Διατήρηση μόνο): Displays only the selected element and hides all others.
Exclude: Temporarily removes the selected element from the view.
These options allow you to focus on the data that interest you the most.
You can select more than one area by using CTRL (or CMD on Mac) + click.
2. Selection filters
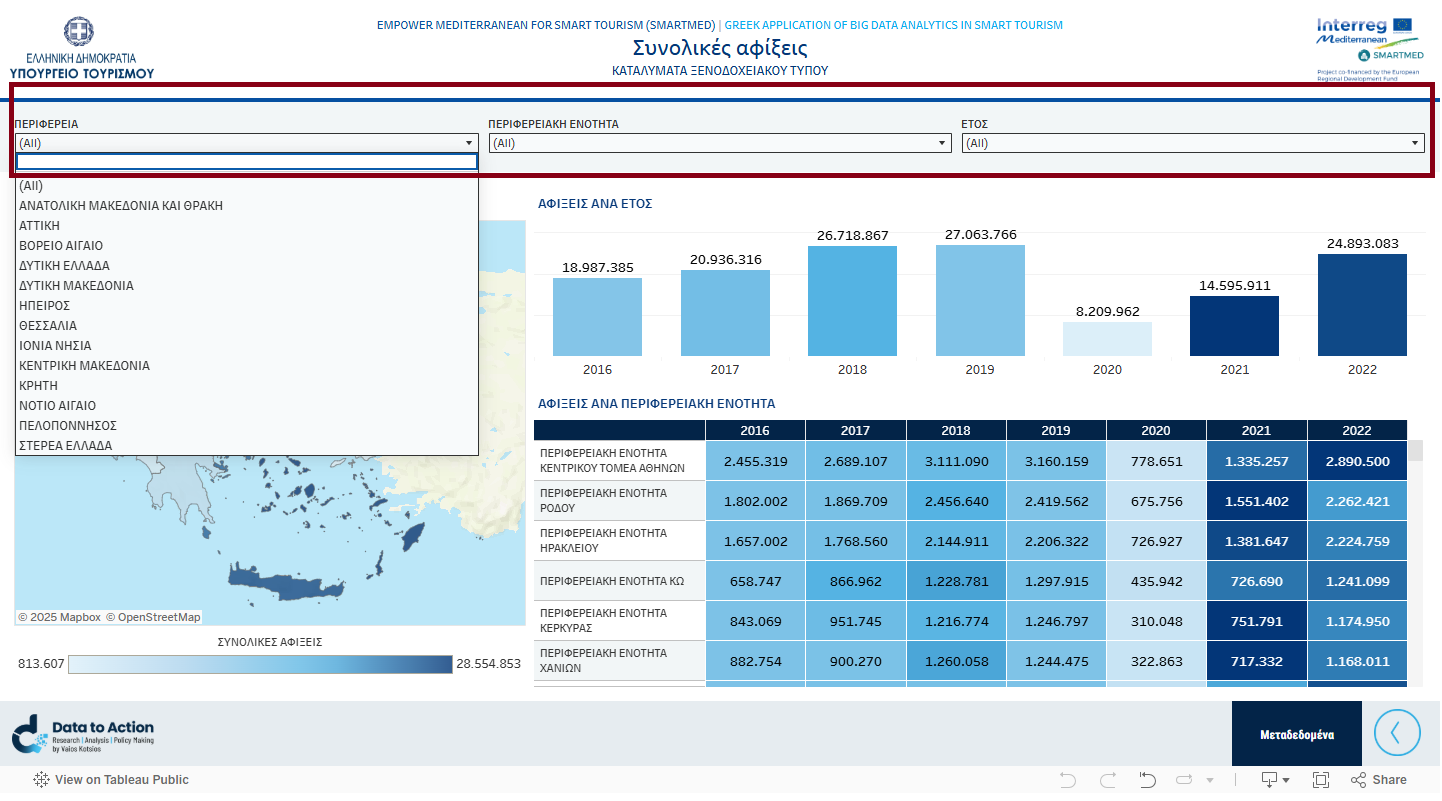
Use the filters (drop-down lists at the top) to refine the data based on the desired criterion.
Tables, charts, and maps are automatically updated based on your selections.
In the first option All of each filter, all values of the field are displayed.
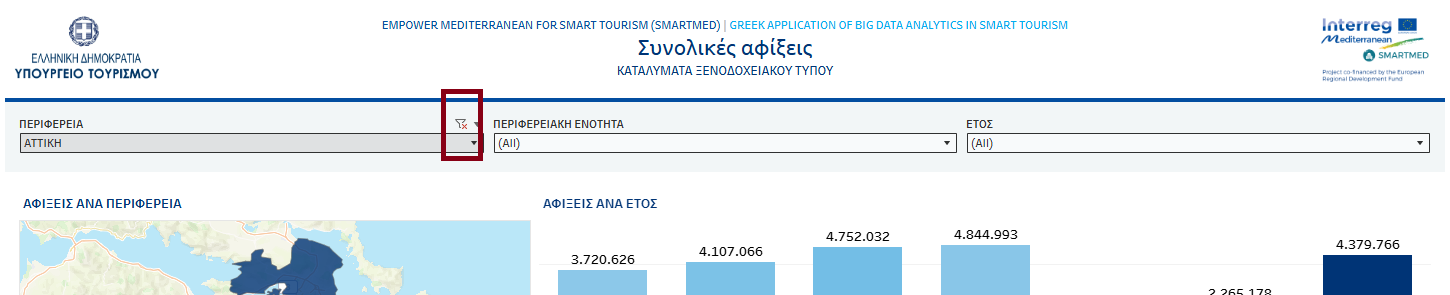
To deselect the filter, click on the Clear Filter icon on the right side of the drop-down list.
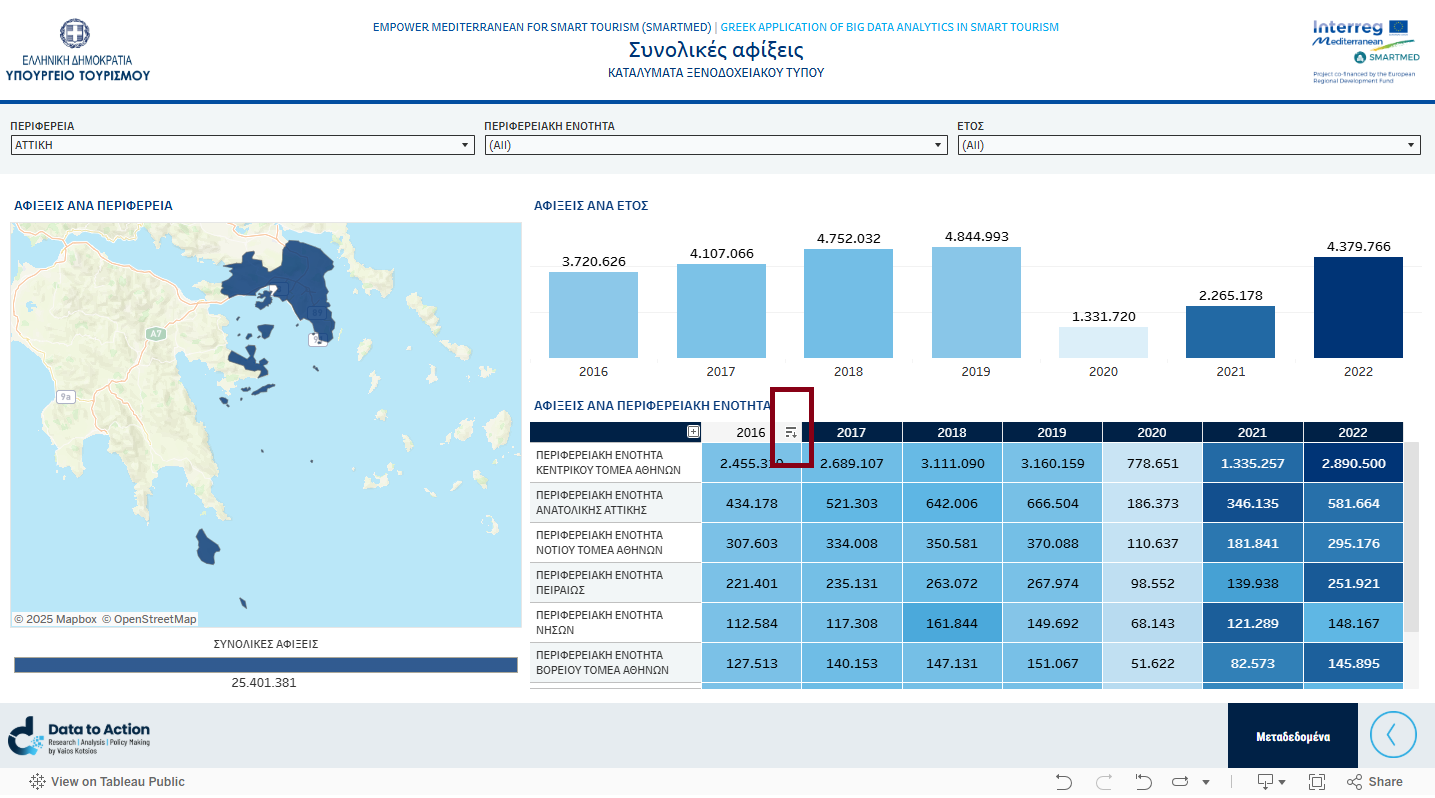
3. Data sorting
In tables, you can change the order of display (ascending/descending) by clicking on the sorting arrows at the top of the columns.
4. Full-screen view
For a more comfortable view, click the Full Screen icon at the bottom right of the interactive dashboard.
By pressing the Esc key again, you return to the normal view.
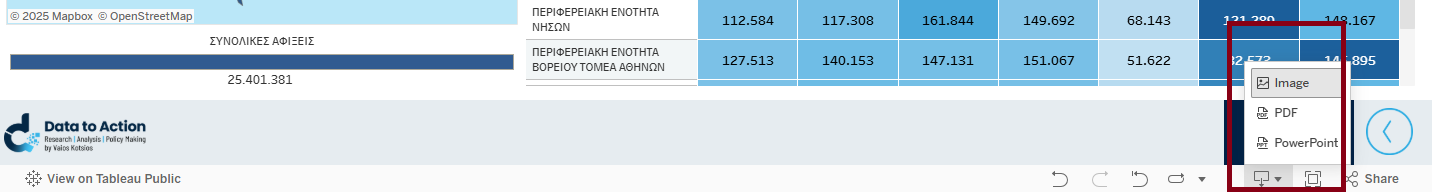
5. Εξαγωγή δεδομένων
You can download the dashboard content by selecting the Download icon at the bottom right.
Select one of the available options:
Image: save the dashboard as an image (.png)
PDF: export to a PDF file
PowerPoint: create a slide with the chart
Note: The available options depend on the settings of each dashboard in Tableau Public.
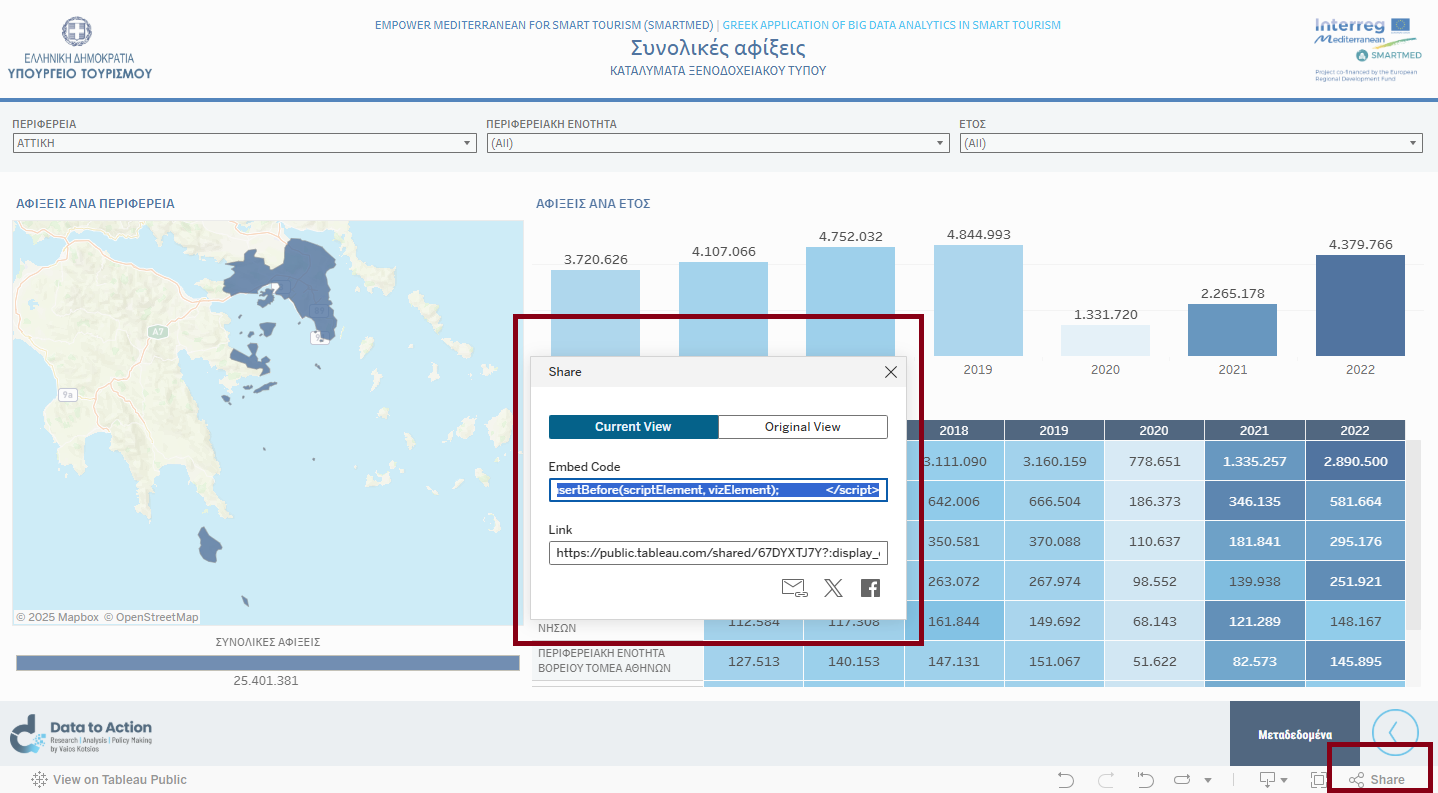
6 Share
You can share or embed the interactive dashboard in two ways:
Click Share (link icon) at the bottom right.
Στο παράθυρο που ανοίγει επιλέξτε:
Current View: κοινοποιεί τη συγκεκριμένη προβολή που βλέπετε εκείνη τη στιγμή.
Original View: κοινοποιεί τη βασική αρχική προβολή του dashboard.
Copy the Link if you want to share the interactive dashboard, or the Embed Code if you want to embed it on a website.
In this way, you can send other users either the overall view or your own filtered data.
7. Undo and Reset
If you want to undo your last action, click the Undo (undo my last action) button.
If you want to return to the initial view, click the Reset (reset view) button.
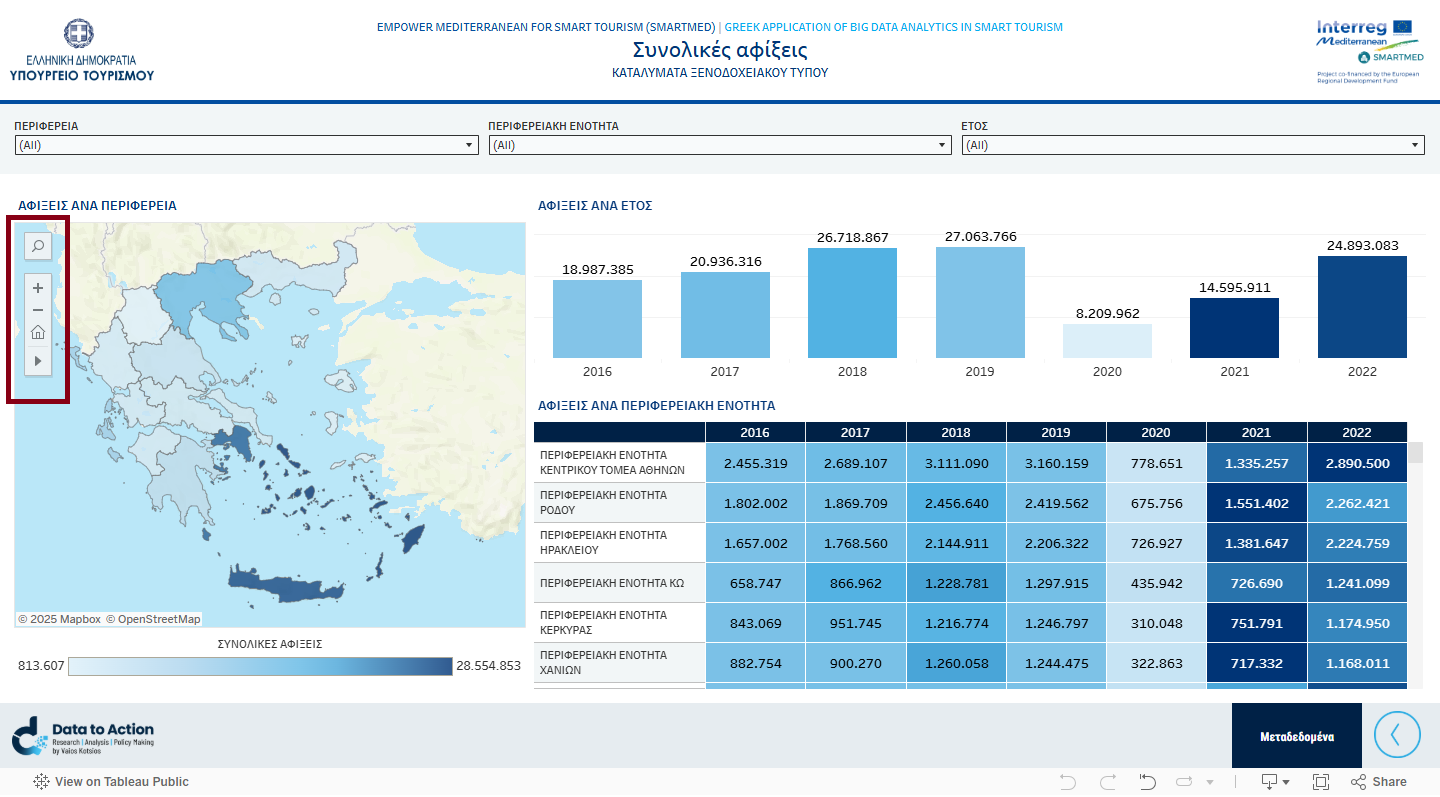
8. Map tools
On a map, by using the toolbar on the left, you can:
Search by typing the place name of interest
Zoom in and out using the +/- symbols
Reset the map to its initial state by clicking on the Home icon.
Tips
If the charts are not displayed correctly, try to refresh the page or open the dashboard in full screen.
On mobile devices, rotate the device to landscape view for a better experience.